The Rise and Fall of CSL: A Case Study in Investor Sentiment
Few stocks have earned a place in the Australian investor psyche quite like CSL. Listed in 1994 at a split-adjusted price of less than $1, it spent the better part of three decades compounding relentlessly — building a global plasma therapies business that became the envy of the healthcare sector. Along the way, it acquired Seqirus to cement its position in influenza vaccines, and absorbed Vifor Pharma to expand into iron deficiency and nephrology. By February 2020, the share price had reached $342.75. For long-term holders, CSL wasn’t just a stock. It was an ASX legend.
What’s followed has proven to be a disaster for shareholders. The pandemic disrupted plasma collections, Vifor introduced integration complexity, and the Seqirus vaccine division faced a structural softening in flu immunisation rates that proved harder to reverse than management anticipated. CSL has delivered a succession of earnings misses and guidance downgrades that, one by one, have stripped away the premium investors assigned to the ASX’s most trusted name. At the time of writing, the stock has fallen a further 20% today following another dramatic profit downgrade — its fourth major guidance cut in two years.
No doubt investors want some answers. How could things have gone so wrong? Management is ultimately responsible for CSL’s performance (or lack thereof), but invariably, many investors are also questioning the advice they received on whether to hold or sell the stock.
CSL is often touted by financial professionals as a cornerstone portfolio investment. This article examines how the broker consensus evolved across five critical snapshot points during its spectacular decline, whether the current bull case holds up, and one unemotional tool that signalled sell nearly the entire way down.
How the CSL Model Broke, and How Broker Consensus Went with It
The table below captures five snapshot points in the Market Index Broker Consensus archive for CSL between July 2024 and May 2026. This covers a period from immediately prior to CSL’s most recent decline, to today. Note, however, the latest May snapshot was taken at the close of business on Friday, 8 May. It does not account for today’s news, but this is preferred as it shows how the brokers were positioned heading into today’s share price plunge.
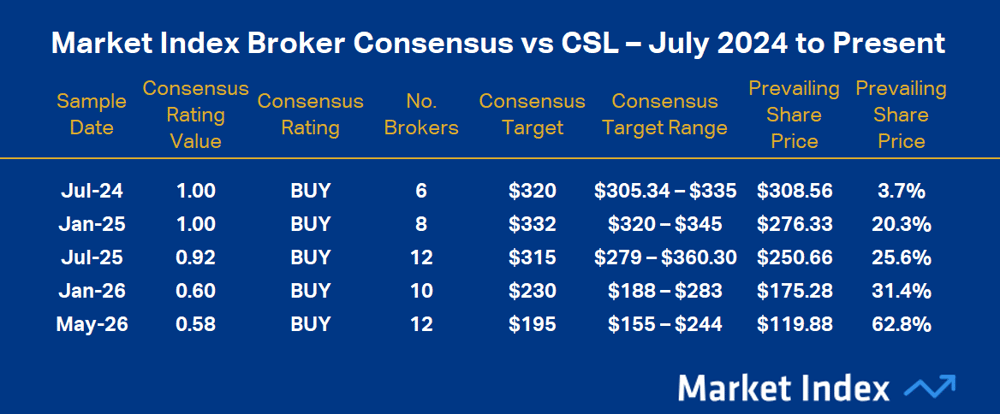
Market Index Broker Consensus vs CSL – July 2024 to Present (8 May, 2026). To obtain a stock’s Broker Consensus Rating, Market Index assigns a value of +1 to any rating better than HOLD/ NEUTRAL/ MARKETWEIGHT, a value of 0 for any rating equivalent to HOLD/ NEUTRAL/ MARKETWEIGHT, and a value of -1 to any rating worse than HOLD/ NEUTRAL/ MARKETWEIGHT. We then take the average of all assigned rating values and assign a Broker Consensus Rating of BUY to values greater than +0.5, a rating of HOLD for values between -0.5 and +0.5, and a rating of SELL for values less than -0.5. The Broker Consensus Target is simply the average of the target prices we have on file for each broker. Typically, brokers define their target prices as a 12-month forecast.
In mid-July 2024, with CSL trading at $308.56, the consensus was a clean BUY — six brokers, average price target $320, implied upside of 3.7%. Unremarkable. A widely held blue-chip stock, trading modestly below target.
The chart below shows how CSL’s share price has fared since that starting point. You will notice that the first major share price decline occurred in August 2024 after the release of the company’s FY24 results. The headline numbers were broadly in line, but guidance for FY25 net profit after tax and abnormal items (“NPATA”) came in below expectations.
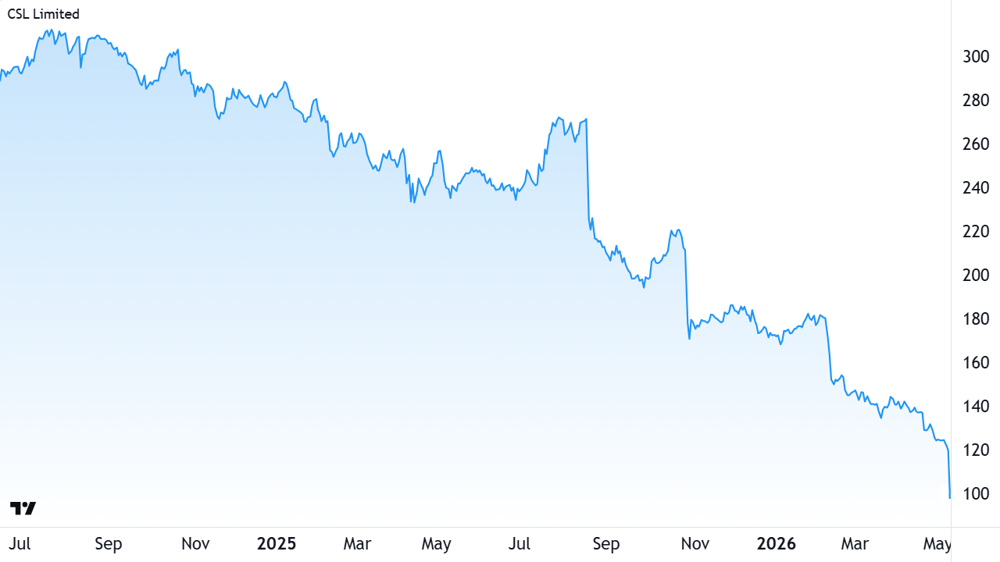
CSL price chart since mid-2024, before the current decline began. Source: TradingView
Brokers trimmed targets but held their ratings. The ‘CSL is a buy’ thesis remained intact, simply the execution had disappointed.
The H1 FY25 result in February 2025 compounded the concern. Seqirus remained the drag, Behring’s margin recovery was being pushed further out, and Vifor faced accelerating generic competition in Europe for its key iron therapy Injectafer. A month before the result, the stock was at $276 — well down from the July snapshot, yet the broker consensus target had moved up to $332. The implied upside widened to over 20% and the stock was a unanimous BUY. A pattern was beginning to form.
The FY25 result in August 2025 was the most damaging single day of the period to that point. CSL announced not just a weak result but a restructuring — a Seqirus spin-off and a 15% headcount reduction. Management also announced a multi-year share buyback. Investors focused on the former, not the latter, and the stock fell 16.9% in the session.
One month prior, the consensus showed 11 out of 12 of brokers still at BUY, and a forecast total shareholder return of over 25%. Then came the AGM in October 2025, just two months later — another shock. CSL walked back its medium-term growth guidance from double digits to high single digits, citing US flu vaccine weakness and China albumin disruption. The stock fell another 15.9% on the day. One broker upgraded it to BUY, framing the sell-off as a buying opportunity. The highest price target among them the day before the AGM was $313.12 — roughly double the $177.86 close. Note that by Friday 8 May, 2026, this particular broker had a $244 target, and remained “Overweight”.
By January of this year, four brokers had moved to a hold-or-equivalent rating. But with the rest of the brokers Market Index had data for at the time still rating CSL buy-or-equivalent, its Consensus Rating Value of 0.60 meant it was still a consensus BUY. By this time, CSL was trading at $175.28 — nearly half of its starting point — implying 31.4% upside to the consensus target of $230. Still no sell-or-equivalent ratings anywhere in the market.
Next came the H1 FY26 result in February 2026, which delivered yet another blow. Revenue missed consensus by approximately 2% and profit by approximately 4%, with Behring the clear drag. Management reaffirmed full-year guidance, but the implied second-half acceleration struck most analysts as ambitious. The stock fell 4.6% on the day, having been down as much as 12% at the open.
This morning — 11 May 2026, the day this article was published — CSL delivered its fourth major guidance reset in two years. FY26 revenue will be approximately US$15.2 billion and NPATA approximately US$3.1 billion on a constant-currency basis — both well short of consensus. Also announced, approximately US$5 billion in non-cash pre-tax impairments across FY26 and FY27 — primarily against CSL Vifor intangible assets — on top of the US$1.5 billion already taken at the H1 result.
The stock fell 20% at the open as Interim CEO Gordon Naylor admitted: “Outcomes have fallen short of expectations, weighing on both growth and investor confidence.”
Outcomes Have Fallen Short of Expectations
That quote from Mr Naylor says it all. Not only has CSL fallen short of expectations with respect to execution and results, but arguably so too has the broking community with respect to the advice provided to investors on whether CSL was a buy, hold, or sell.
On Friday, 8 May, the consensus target of $195 implied over 60% upside from a closing price of $119.88. The range across twelve covering brokers runs from $155 to $244 — an $89 spread on a $120 stock. That dispersion alone signals how much uncertainty surrounded the CSL investment case heading into today’s debacle. The Consensus Rating Value of 0.58 pegged CSL at a BUY, with five of the twelve brokers Market Index had data for at a buy-or-equivalent rating, and the others at a hold-or-equivalent rating.
Crucially, none had a price target below the share price at the time of writing of $99.60 (i.e., none predicted an ongoing share price decline), and none were calling SELL. No doubt, following this morning’s announcement, every one of those targets is likely under review.
90 Warning Signals the CSL Model Was Broken
There was one place investors could have turned for an unbiased view of CSL’s decline. Market Index’s ChartWatch ASX Scans series publishes daily lists of stocks deemed to be in uptrends or downtrends, based on the ChartWatch Technical Analysis Model.
The model is grounded in a simple economic premise: when demand for an asset exceeds supply, its price will rise; when supply exceeds demand, its price will fall. From that foundation, the model identifies when buying pressure is exceeding selling pressure, and vice versa.
Stocks exhibiting excess demand appear on the ChartWatch Uptrends List — candidates for buying. Stocks exhibiting excess supply appear on the Downtrends List — candidates for avoiding, selling, or short selling. The model makes no earnings forecasts, consults no broker targets, and holds no views on CSL’s fundamentals.
Crucially, the model concedes it cannot predict the future — no methodology can. What it does is identify the prevailing trend and assume it will continue until the evidence says otherwise. When a stock loses its uptrend characteristics, the disciplined response is exit. When a stock exhibits persistent downtrend characteristics, the disciplined response is to stay away. In the ChartWatch framework, there is no room for hope or reassuring oneself that “it will all be okay” if one holds on long enough.
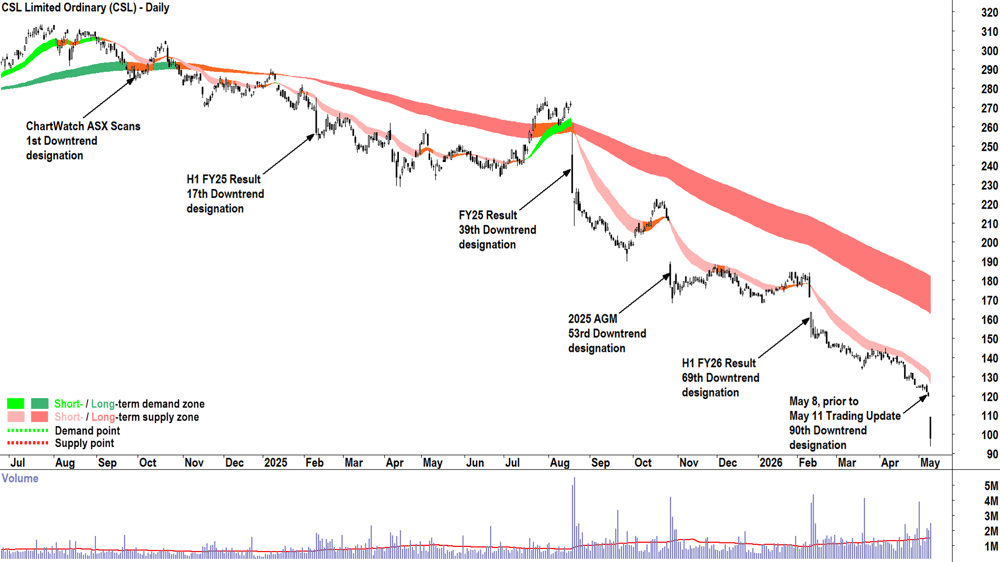
CSL price chart showing major events since 2024 and ChartWatch downtrend designations
The chart above shows that since 27 September 2024, when CSL’s share price was $285.10, the stock appeared in the ChartWatch ASX Scans’ Downtrend List 90 times — 65 times as a “Feature” chart — the Model’s highest conviction downtrend.
Interestingly, CSL did appear once during the period as an uptrend, on 13 August 2025, as CSL rallied from the April low around $230 to $275 just before the 19 August release of the company’s FY25 results. The next downtrend designation came on that fateful day, in what was to be an unbroken run of 51 further downtrend calls.
Conclusion: Know the Fundamentals, Confirm with the Chart
One buy and 90 sells on CSL since its current devastating share price plunge began? If any of the major brokers had such a track record, they’d be lauded for their incredible expertise and foresight in predicting one of the greatest declines in ASX blue chip history.
Of course, it would be unfair to suggest the brokers got everything wrong. The structural case for CSL — secular immunoglobulin demand, plasma cost normalisation, a transformation program targeting hundreds of millions in annual savings — remains intact in the models of most covering analysts and they may yet be proven right.
But being right while holding through a 70% drawdown over several years will be cold comfort for most investors — should it occur.
In the days ahead, broker updates will follow this morning’s guidance reset — targets will be cut, some ratings may shift, and the consensus picture will change. Keep an eye on the Market Index Broker Consensus page to stay abreast of the latest broker ratings and target updates. What is unlikely to change is the ChartWatch verdict: it could be downtrend designation number ninety-one for CSL in tomorrow’s edition.
Want free investment tools and ASX research?
Market Index provides investors with access to:
- Broker consensus
- ASX announcement data
- Dividend information
- And a whole lot more…
Click here to access everything 100% free at Market Index